Categories
Diversity Statistics Workplace Diversity

Race, Gender, and LGBTQ+ wage gaps are real – and they end up costing us all

White males make up the largest sector of the U.S. workforce and have, on average, always made the highest salaries. If we compare their salaries to those of women, ethnic minorities, the differently-abled, and LGBTQ+ persons, we see a large disparity between the wages of similarly-qualified candidates in the same fields.

The gap is glaring, and unfortunately, eliminating it isn’t as simple as raising salaries for other employees. It requires attention to differences in education, experience, and seniority, even though we know such factors are affected by the same biases that determine salary.

To complicate matters, agreeing on how to measure the wage gap with so many variables is murky at best. For example, a Pew Research Center analysis of median hourly earnings of both full and part-time workers in the United States found that women earned 85% of what men earned – a 15% wage gap. By comparison, the Census Bureau in 2017 found that full-time, year-round working women made just 80% of their male counterparts – a 20% wage gap. The AAUW’s 2019 updated wage report found a 35% difference between the salaries of the average woman ($45,097) and man ($55,291) in America. PayScale’s 2020 survey women make only $0.81 for every dollar a man makes.

Our cultural expectations of women as caregivers throw another wrench into the calculations, especially in light of the COVID pandemic. While a 2018 study by the Institute for Women’s Policy Research (IWPR) showed that women faced an actual wage gap of 51% between 2001-2015, those who took just one year off from work had annual earnings 39% lower than those of women who remained in the workforce. Their updated 2020 study “Build(ing) the Future: Bold Policies for a Gender-Equitable Recovery” revealed that women have also experienced a disproportionate number of job losses since the start of the pandemic. From February to May 2020, 11.5 million women lost their jobs, compared with 9 million men.

But it’s also important to note that 4 times as many women aren’t currently looking for work compared to men. In the words of the IWPR, we are experiencing a “shecession” that has seen 865,000 women drop out of the labor market altogether between August and September 2020. That’s because family care responsibilities fall predominantly to women. Homeschooling as well as child and elder care are making it impossible for women to reenter the workforce at the same rate.

Who gets paid the most (and least)? 

Data from Hired’s 2019 survey highlight the inequality between men and women:

  • 60% of men are offered 3-4% more for the same role as women at the same company, which is technically illegal in the U.S.
  • 41% of the time, companies interview only men for an open position.
  • 61% of the time, women are asking for lower salaries than men (this was true in all fields).

Data from AAUW’s 2019 report suggests even more gender wage disparity when we break the statistics down by race.  On average, for every dollar made by white men…[su_pullquote align=”right”]…it’s also important to note that 4 times as many women aren’t currently looking for work compared to men. In the words of the IWPR, we are experiencing a “shecession” that has seen 865,000 women drop out of the labor market altogether between August and September 2020.[/su_pullquote]

  • Black women made 62 cents
  • Hispanic women made 54 cents
  • Asian women made 89 cents
  • Native Hawaiian or Other Pacific Islander women made 61 cents
  • American Indian or Alaska Native women made 57 cents

In addition, the pay gap increases throughout a woman’s career and is widest for women ages 55-64.

These numbers show general trends but differ year-to-year by survey, industry, location, and education levels. A lack of reporting from some groups and career sectors also hinders precise measurements. Nevertheless, dozens of studies and surveys have corroborated evidence of a gap between white men and other groups in all fields of employment.

The power of transparency

One of the biggest problems in assessing the wage gap is getting accurate salary data. Studies have shown that most employees are uncomfortable sharing salary information, and even go to great lengths to conceal their pay from coworkers. At times, Employers actively discourage sharing salary information.

But there’s a small group of people leading the charge to be more transparent. Employees from many sectors have made efforts to share wage data online so it can be accessed and assessed. These websites and spreadsheets often don’t ask for names, but rather positions, education, experience, location, salaries, and other benefits. Of course, the problem, even for well-known salary comparison sites like Glassdoor, is that the information is crowd-sourced and unverified. But while there’s always the possibility for dishonesty, it’s given many employees a good reference point for negotiations.

Knowing where you stand in the wage hierarchy also affects morale. Seeing how much (or little) someone else makes can lead to anger and resentment until the problem is solved. Employees need more tools for asking about equal pay at work, and employers owe it to them to explain discrepancies to reduce wage gaps that exist because of pure bias.

Who is underpaid? 

Women

It has been illegal for companies to pay women less for the same job as men for over half a century in America. Nevertheless, it happens all the time – sometimes without companies even realizing it because they don’t keep those sorts of statistics. But with the now constant calls for equal pay and increased diversity, employers can no longer afford not to identify and improve salary inequalities.

[su_pullquote align=”right”]The vast majority of non-white workers are paid less than their white counterparts. And the disparity is always the largest for minority women. [/su_pullquote]Plain, old-fashioned bias is likely the main reason that women are paid less than men, even for the same job. We tend to devalue what we consider to be “women’s work”, resulting in occupational segregation, where even skilled jobs typically held by women tend to come with lower wages. And because women have internalized a lower “worth” in terms of salary, they commonly ask for less than men when negotiating their compensation packages. Without knowing what colleagues make, most women are flying blind when it comes to salary negotiations.

Women are also disadvantaged in the workplace because domestic duties – from bearing and raising children to eldercare – often fall to them, necessitating time off from work. This is also why women tend to be overrepresented in part-time work, which is often paid hourly and at a lower rate than full-time work.

It’s crucial to remember that wage inequality isn’t just an issue for the underpaid, however. It affects the entire economy and, therefore, all of us. Women are the sole or co-breadwinners in two-thirds of American households, so their wages affect the well-being and need for social services of other dependants.

On average, here is how much women of different ethnicities earn for every dollar earned by white men:

*source: AAUW’s 2019 report, The Simple Truth about the Gender Pay Gap


To top it off, the pay gap increases with age. And no matter how long a woman has been working, she may have a good chance of facing an income gap in retirement as well. Anyone who has earned less over their working years will have lower Social Security payments. The AAUW report also found that women lag behind men in pension benefits and every source of retirement income.

Ethnic minorities

The vast majority of non-white workers are paid less than their white counterparts. And the disparity is always the largest for minority women.

Data from Pew Research in 2016 showed that white and Asian women have narrowed the wage gap with white men to a much greater degree than black and Hispanic women (though this is a hard population to get a handle on because of its diversity). White women narrowed the wage gap in median hourly earnings by 22 cents from 1980 to 2015; black women by 9 cents; Hispanic women by just 5 cents. Asian-American and Pacific Islander women narrowed the gap by 27 cents.

[su_pullquote align=”right”]While it’s easy to suggest that education is the reason for this disparity, the evidence does not support such a theory. College-educated black and Hispanic men (as well as white and Asian college-educated women) still earn roughly 80% of what their white college-educated colleagues earn.[/su_pullquote]Pew’s research showed that black and Hispanic men made almost no progress in narrowing the wage gap with white men since 1980. As of 2015, black men still earned just 73% of white men’s hourly earnings, while Hispanic men earned 69% (down from 71% in 1980).

While it’s easy to suggest that education is the reason for this disparity, the evidence does not support such a theory. College-educated black and Hispanic men (as well as white and Asian college-educated women) still earn roughly 80% of what their white college-educated colleagues earn. Black and Hispanic women earn less than 70% of what similarly educated white men are paid.

In fact, a 2020 update from the AAUW found that Black women with a high school degree earned 65.99% of what similarly educated white men earned. But when they completed a bachelor’s degree, their earnings actually dropped to 65.14% of what white men made. The same was true for Latinas, whose earnings went from 66.78% to 62.73% after graduating with a bachelor’s. Native American women’s numbers went from 66.7% to 59.2% after getting a higher degree.

Even when we control for education – since the number of black and Hispanic college-educated workers is lower – they still make less money than whites.

The differently-abled

According to the U.S. Census, the U.S. has roughly 9 million workers that identify as disabled (and likely many more since invisible disabilities are underreported).

[su_pullquote align=”left”]…this wage gap has some serious consequences for the American economy. They estimate that if workers with disabilities received the same pay as their colleagues, they would add $141 billion to the economy (or 1% of the GDP).[/su_pullquote]In the early years of someone’s career, those with the most commonly-reported disabilities (ambulatory, hearing, and cognitive) tend to concentrate in certain sectors. Census data shows that median earnings are “about the same” as those without ($.87 on the dollar). However, these workers are less likely to work full-time or year-round.

The American Institute for Research (AIR) has shown that people with disabilities earn on average 37% less than non-disabled people, and the pay gap actually increases with higher education levels.

More recent Census data found that among the 11 million employed Americans with disabilities, their median earnings were just 66% of that of their non-disabled peers. The Brookings Institute found that as of 2018, disabled people with a high school degree had a 10% lower employment rate than non-disabled people. Among disabled college graduates, the employment rate was 27% lower. AIR reported that the annual disability pay gap among workers with Master’s degrees was over $20,000 per year.

There’s plenty of doubt about whether these numbers will change in the near future. Harvard Business Review reports that while 90% of companies say they prioritize diversity and inclusion in the workplace, only 4% consider disability in these efforts.

AIR’s data (from 2014) also showed that this wage gap has some serious consequences for the American economy. They estimate that if workers with disabilities received the same pay as their colleagues, they would add $141 billion to the economy (or 1% of the GDP). The country is also missing out on roughly $25 billion of tax revenue, and states could be bringing in $6.5 billion if the wage gap among the disabled was remediated.

Again, the wage gap hurts us all.

It may come as no surprise at this point, but women with disabilities are at a bigger disadvantage than their male counterparts. They’re about half as likely as disabled men to have jobs and work full-time.

LGBTQI+ persons

Due to discrimination, Lesbian, gay, bisexual, transgender, queer, and intersex employees don’t always identify their status at work, so it’s hard to get a grasp on precise wage gaps. The data we do have, however, reminds us that wage disparity is not just a gender or racial issue.

Often referred to simply as the “gay wage gap,” studies have shown that gay and bisexual men earned between 10% to 32% less than similarly qualified heterosexual men. Interestingly, lesbian and bisexual women tended to earn the same or sometimes more than heterosexual women. However, they still earned less than both heterosexual and gay men.

The National LGBTQ Task Force’s 2011 report “Injustice At Every Turn” has a wealth of data on transgender workers and their families, but their wage gap is even harder to measure since gender pay gap legislation requires employers to report on “men” and “women,” leaving no room for transitioning and gender non-conforming workers.

We know that there is a wage gap, as well as a significant increase in poverty levels among transgender individuals. But one telling statistic is that the earnings of male transgender workers slightly increased following their transition, whereas the wages of female transgender workers fell by nearly one-third. There have been multiple stories by transgender women attesting to the fact that they didn’t notice a significant gap in their wages or employment opportunities until they became women.

It should go without saying that sexual orientation and gender identity have no effect on job performance. Still, until Congress passes the Employment Non-Discrimination Act (ENDA), which would prohibit most employers in the United States from discriminating against workers based on sexual orientation or gender identity, we will likely continue to see these wage disparities.

Why do companies pay some people less, and what can we do about it?

[su_pullquote align=”right”]By attributing pay gaps to the choices individuals make and downplaying the role of discrimination, we willfully obscure the fact that they are persistent and universal.[/su_pullquote]Plenty of people have insisted that education, workforce experience, industry, occupation, seniority, salary expectations, family obligations, overtime, and full-time versus part-time work account for all wage gaps. But such arguments fail to account for discrimination, which plays a central role in equal pay.  

By attributing pay gaps to the choices individuals make and downplaying the role of discrimination, we willfully obscure the fact that they are persistent and universal. And since some discrimination is the result of unconscious bias, trying to dismiss it as a reason for unequal pay robs us of the chance to understand the employee compensation system – and ourselves – better. The first step is to take a close look at where our economy provides unequal opportunities for people from education to training to career choices.

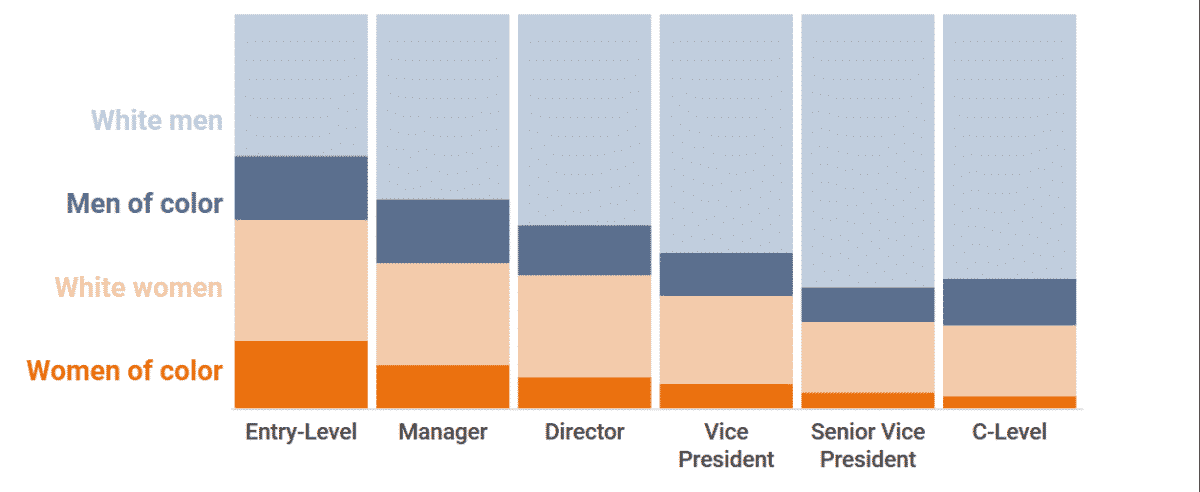
A person’s job choice is influenced by choices about educational paths, the presence of and advice of mentors, familial and societal expectations, the hiring practices of companies, and expectations about what their roles are outside of work. Women and minorities are at a disadvantage all along this path as they’re led into different types of roles based on societal expectations. We can’t underestimate just how much a lack of role models and mentors in a field or hostility in the college classroom plays a role in discouraging someone from entering it. And even if they do, the lack of diversity at the top levels of a company is discouraging – it’s a sign that no women or minorities have been promoted before them.

Take computer science, for example. It’s often listed as one of the highest-paying college majors, and at one time the number of women studying computer science was growing faster than the number of men. But with the rise of tech culture and personal computers (which was most often gifted to boys in their younger years), fewer girls were prepared to enter computer science classes in college because they didn’t grow up playing with the devices. When they do enter coursework or the major, they find a male-dominated and sometimes hostile environment that expects women to conform to male gender norms. The “bro culture” that developed in computer science made women the targets of sexual harassment and constant discrimination. And to top it off, they’re typically left out of social opportunities and even mentoring that can help them get ahead. That’s the kind of discrimination that leads to unequal pay.

Transparency is the key to equality

It’s important to note that closing the wage gap isn’t about paying people with fewer qualifications or fewer working hours the same salary as more qualified people. It’s about giving everyone the chance to earn the same wage regardless of their age, gender, ethnicity, disability status, sexual orientation, etc. To assume that those who want to close the wage gap want to give less qualified candidates the same wage is to build a straw man. 

[su_pullquote align=”left”]It’s important to note that closing the wage gap isn’t about paying people with fewer qualifications or fewer working hours the same salary as more qualified people. It’s about giving everyone the chance to earn the same wage regardless of their age, gender, ethnicity, disability status, sexual orientation…[/su_pullquote]Giving women and other underpaid groups raises across the board simply because there is a wage gap would give rise to myriad problems. It might be prohibitively expensive for some companies or raise other legal liabilities. Raises across the board may reduce incentives and privilege underqualified workers, and may also signal to underperforming employees that their performance is adequate when it’s not.

But companies ought to look at their salary numbers and employee data, identify any unexplained wage gaps, and try to figure out how they came to be (for example: Are women hired with lower salaries? Are their raises smaller?). At that point, they can make an informed decision about closing and preventing wage gaps and eliminating discrimination.

With the Equal Employment Opportunity Commission announcing in 2019 that it would stop collecting pay data broken down by sex and race from larger employers; unfortunately, we’re moving farther away from that kind of useful data.

Conclusion

In the end, we all end up paying for the wage gap in one way or another. Driving families into poverty can help perpetuate a vicious cycle of underemployment and continued low wages.

As we’ve seen, the tax revenue and subsequent boost to the economy that would come with evening out wages for similarly qualified workers is measured in the billions of dollars. Closing the wage gap could be seen as a common good. After all, equal pay is the law in the U.S. for many underpaid groups.

But as long as we deny that a wage gap exists or obscure the information that would allow us to carefully identify their causes, we won’t get very far.

Further Reading: 

The State of the Gender Pay Gap 2020 (Payscale, 2020)

The Simple Truth About The Gender Pay Gap: A 2020 Update (AAUW, 2020)

___

Visit our workplace diversity hub for further reading relating to current challenges faced by women and people of color, wage gaps, successful inclusion strategies, diversity in corporate and government leadership, effective talent acquisition and diversity programs, and how artificial intelligence affects diversity outcomes.

Categories
Diversity Statistics Workplace Diversity

We Know Diversity is Good for Business, So Why Do Corporate Leaders Remain Predominantly White and Male?

An examination of diversity in senior leadership roles at America’s top companies

Diversity is more than just a buzzword, it’s a recipe for corporate success.

Multiple studies have shown that a more diverse workforce in terms of age, gender, ethnicity, as well as veteran, disability, and LGBTQIA+ status can bolster innovation.i A more diverse corporate talent pool is a competitive advantage not only because it helps companies create better products but because it helps them attract and retain the best talent from all over the world.ii

In terms of revenue, companies with greater racial and ethnic diversity are likely to have financial returns above national industry medians. For example, in McKinsey’s reports on corporate diversity in 2014, 2017, and 2019, researchers found that companies in the top quartile for gender diversity on executive teams were increasingly profitable – 15% more in 2014, 21% more in 2017, and then 25% more as of 2019’s analysis. Alas, female representation on executive teams rose just 1 percentage point globally between 2017 and 2019, to 15%. Over one-third of companies in their global data set still had no woman at all on those teams.iii

When it came to ethnic and cultural diversity, the most diverse companies outperformed the least in terms of profitability by 36% in 2019, up from 33% in 2017.  In fact, the likelihood of outperformance by ethnically diverse companies is even higher than it is for gender and yet the representation of ethnic minorities rose to only 14% globally (up from 12% in 2017).

[mks_separator style=”dotted” height=”2″]

If diversity is so beneficial to a company’s bottom line and its workforce…why do they remain predominantly white and male from the staff to the C-suite and board?

[mks_separator style=”dotted” height=”2″]

When it comes to work-life balance, diversity among corporate leaders is key. Even twenty years ago, a study found that when women and people of color held half or more of the top jobs, companies were far more likely to provide flextime and childcare – an issue now equally important for men and one that leads to better morale, higher retention rates, and a more productive workforce.v

If diversity is so beneficial to a company’s bottom line and its workforce, why have the largest companies made so little progress in this area?  And why do they remain predominantly white and male from the staff to the C-suite and board?

Even more perplexing is a 2020 PricewaterhouseCoopers survey of corporate directors. Researchers found that 84% agree that companies should be doing more to promote gender and racial diversity in the workplace while only 34% say it is very important to have racial diversity on their board. Only 47% of directors said gender diversity was very important and a mere 39% thought D&I objectives should be rewarded via executive pay plans.

But while a 2018 PwC study found that 91% of directors have taken steps to increase diversity, 52% still think these efforts are simply driven by political correctness and 48% said their shareholders are too preoccupied with the topic..vi

Granted, correlations do not prove causation. But we do have mounting evidence of such correlations. The strategic decision would, therefore, be to capitalize on the emerging talent pool of diverse employees and create a culture where innovation thrives.

GENDER DISPARITY

Women are still underrepresented at every level in corporate America even though they have been earning more college degrees than men for roughly 30 years.vii

DiversityJobs.com, corporate pipeline by gender and race
Infogram

Despite the visibility of women leaders over the last decade, they are still woefully underrepresented in leadership positions. But there is some good news. By 2019, there were no all-male boards in the S&P 500, more than one-quarter (26%) of board directors were women (a record high), and accounted for nearly half (46%) of all new board directors in the S&P 500. Last year, 10% of those board directors were women of color.

Now that we are 3 years into the #MeToo movement, there is also evidence to suggest that there have been unintended consequences that have actually made it more difficult for women to advance their careers. 2019 survey conducted by LeanIn.org and SurveyMonkey found that 60% of male managers are now uncomfortable performing everyday workplace activities such as mentoring, working one-on-one, or socializing with women, which represented a 32% increase over last year.  Since mentoring and networking are vital to advancing one’s career, how are women supposed to take advantage of these benefits if men are afraid to be around them? 

[mks_pullquote align=”left” width=”300″ size=”22″ bg_color=”#e0995e” txt_color=”#ffffff”]To add to the absurdity, in 2018 there were more men named James in Fortune 500 chief executive positions than all women put together.[/mks_pullquote]To make matters worse, our knowledge of gender parity is severely lacking in corporate America due to underreporting. Only 3% of Fortune 500 companies openly share diversity data since it’s not a requirement. But digging deeper into news stories and interviews with corporate leaders can reveal gender and ethnicity data. For example, it shows that as of September 2020, a record 38 Fortune 500 CEOs were female. If you are keeping score, that’s still just 38 out of 500.

To add to the absurdity, in 2018 there were more men named James in Fortune 500 chief executive positions than all women put together – and women outnumbered men named John (who were also all white) by just 2.ix

Fortune 500 Board Members Gender
Infogram

On the other hand, S&P companies report more diversity data, but the news is mixed. Women account for just 6.2% of CEOs at S&P 500 companies in 2020 (32 total). Back in January, 44.7% of employees at these companies were women, but they only made up 36.9% of first or mid-level management. The numbers drop significantly the higher you go – only 26.5% of executive or senior-level executives were women.

While today 27% of S&P 500 board members are women, a 2017 report showed that women and minorities accounted for nearly half of the roughly 400 newly-created independent directorships at these companies, with women holding 32% of the positions and Black, Hispanic, and Asian workers holding 15% (though this was down from 18% in 2015).x

While today only 21.2% of S&P 500 board members are women, a 2017 report showed that women and minorities accounted for nearly half of the roughly 400 newly-created independent directorships at these companies, with women holding 32% of the positions and African-Americans, Hispanics, and Asians holding 15% (though this was down from 18% in 2015).xi

But as investigative journalist Susan Reed has explained, “a highly diverse board does not necessarily mean that the executives who run a company are — or ever become — truly diverse.” Furthermore, boards frequently serve as “smokescreens” that “conceal just how white a company’s leaders (the CEO and his team) are.” In fact, the more diverse a company’s board is, the more likely their management teams are to be white.xii

Reed also notes that while the average share of female and minority executives has increased, white women have achieved these positions at a much higher rate than people of color, which has created a racial glass ceiling.

ETHNIC DIVERSITY DATA

While most Americans still identify as white, statistical projections have made it clear that the nation will become minority white by 2045.xiii In 2017, African Americans comprised 13.4% of the U.S. population and Hispanic and Latino Americans 18.1%. The Hispanic and Latino population is expected to grow the fastest, reaching 24.6% by 2060.

[mks_pullquote align=”right” width=”300″ size=”22″ bg_color=”#5a6f8c” txt_color=”#ffffff”]…the researchers found that if company performance declined during the tenure of a minority CEO, they were likely to be replaced by white men who were subsequently seen as “saviors” of the organization if it eventually recovered.[/mks_pullquote]Comparing board diversity in Fortune 500 companies between 2016 and 2018, the presence of Black women increased by 26.2% (an increase of 32 seats). Black men saw an increase of 8.5% (26 seats), Hispanic/Latino men on board increased 14.3% (gaining 21 seats), and Hispanic/Latina women saw a gain of 9.8% (but only 4 seats). The biggest gains in Fortune 500 board seats were achieved by Asian/Pacific Islander women, with an increase of 38.6% (17 seats). Men of Asian/Pacific Island ethnicity saw an increase of 20.3% (25 seats).

Today, there are only 3 Black Fortune 500 CEOs. None of them are women.

Nevertheless, the most recent data from a 2018 Catalyst report showed that Caucasian/White men held 66% of all Fortune 500 board seats and 91.1% of chairmanships on those boards – nowhere near representative of the actual population – and still hold the majority of power positions even in companies with diverse boards..xiv

Nevertheless, Caucasian/White men still hold 66% of all Fortune 500 board seats and 91.1% of chairmanships on those boards, nowhere near representative of the actual population and still holding the majority of power positions even in companies with diverse boards.

Fortune Board Radial
Infogram

When it comes to Fortune 100 companies, the numbers are slightly better, though 23% of those companies do not release demographic data. In 2018, 19.5% of Fortune 100 company board seats were held by minorities, compared to 16% of Fortune 500 seats. Black women saw a 44.8% increase in seats – the largest of any group (though that represented just 13 seats). Caucasian/White men saw a decrease of 3% (23 seats) and men of all ethnicities saw a 1.2% decrease (or 11 seats).

While there’s been significant progress in achieving parity on boards, C-suite executives are actually less diverse now than they were a few years ago. Currently, there are just three black CEOs running Fortune 500 companies (5 fewer than there were three years ago) and the number of women CEOs dropped 25% (to 24 since) between June 2017 and May 2018.xv

Another troubling obstacle for diverse leaders? The so-called “glass cliff.” A 2013 study of 15 years of leadership in Fortune 500 companies showed that women and minorities are often appointed to leadership roles during periods of crisis or failure within an organization, making them far more risky to take on. To make matters worse, the researchers found that if company performance declined during the tenure of a minority CEO (which seems likely if one inherits serious problems), they were likely to be replaced by white men, who were subsequently seen as “saviors” of the organization if it eventually recovered.xvi

ARE MILLENNIALS THE ANSWER?

It turns out that we may have millennials – typically defined as those born between 1981 and 1996 – to thank for making the workplace more diverse.

This generation will make up 75% of the workforce by 2025, and their ideas about diversity are far more nuanced than their predecessors’.xvii Not only that, but they make up 30% of the voting population, so they have the power to be changemakers on multiple fronts.xviii They’re also a more diverse generation and overwhelmingly believe that diversity and inclusion lead to innovation and they’re far more likely to stay in jobs where they feel valued and accepted. Better yet, their definition of diversity is not limited to gender and ethnicity but includes LGBTQIA+, veteran, and disability status as well.

They’ll also have Generation Z – the most racially diverse generation in American history to back them up.  By 2020, 50.2% of children under 18 will come from a minority ethnic group.xx

[mks_separator style=”dotted” height=”2″]

Generation Z…the most racially diverse generation in American history…are young, educated, socially active and they are ready to change the way we all work.

[mks_separator style=”dotted” height=”2″]

In order to retain top talent and ensure healthy futures, companies will need to recognize the importance of these workers. Young people already show decreasing company loyalty – 43% of Millennials envision leaving their jobs within two years and 61% of Gen Z says they would leave within two years if given the choice.xxi

Why? Well, they don’t feel valued in the workplace; they expect flexibility and a positive work culture that helps them build skills; and they care deeply about ethical behavior and making positive contributions to society. They are young, educated, socially active and they are ready to change the way we all work.xxii They’re also about to outnumber older generations of workers who dismiss them as flaky and idealistic.

Still, there’s a long way to go before women and minorities in these groups are represented at the top. They will demand change, but it won’t happen overnight and companies would be wise to expect some growing pains as they adapt to their new workforce and future executives, especially as older generations work into their 70s.

If projections are correct, the number of women in the labor force will grow faster than that of men, increasing to 47.2% in 2024.xxiii By that time, Hispanics are projected to be nearly 20% of the labor force (30% by 2060), with African-Americans making up 12.7%, and Asians 6.6% – all an increase over 2014 demographics.xxiv

But the workforce and corporate leadership are two very different things, and the growing diversity of the workforce does not mean that women and minorities will automatically move into positions of power. That will still require a concerted effort to provide leadership and mentoring opportunities as well as useful diversity training.

We’re making progress and a diverse workforce is waiting in the wings. But it’s still up to those in charge to harness its power and prepare their companies for the next generation.

___

Visit our workplace diversity hub for further reading relating to current challenges faced by women and people of color, wage gaps, successful inclusion strategies, diversity in corporate and government leadership, effective talent acquisition and diversity programs, and how artificial intelligence affects diversity outcomes.

Further Reading

Sources Cited

i Quick Take: Why Diversity and Inclusion Matter (Catalyst, Aug 01, 2018).

iii Vivian Hunt, Dennis Layton, and Sara Prince, Why Diversity Matters (McKinsey & Co., January, 2015).

iv The report requires login credentials, but you can see a rundown of the data in the PR Newswire press release “Bersin by Deloitte: Diversity and Inclusion Top the List of Talent Practices Linked to Stronger Financial Outcomes” (Bersin by Deloitte, November 12, 2015).

v Jennifer Tucker, Leslie R. Wolfe, Edna Amparo Viruell-Fuentes, and Wendy Smooth, No More “Business as Usual”: Women of Color in Corporate America (Center for Women Policy, March 1999).

vi PwC, 2020 Annual Corporate Directors Survey (Governance Insights Center, 2018). See the summary here.

vii Alexis Krivkovich, Kelsey Robinson, Irina Starikova, Rachel Valentino, and Lareina Yee, Women in the Workplace (McKinsey & Co., 2017).

viii Catalyst, Quick Take: Women on Corporate Boards (December 21, 2018).

ix Claire Cain Miller, Kevin Quealy, Margot Sanger-Katz, “The Top Jobs Where Women Are Outnumbered by Men Named John” (The New York Times, April 24, 2018).

x Catalyst, Pyramid: Women in S&P 500 Companies (Jun 11, 2019).

xi Spencer Stuart, United States Spencer Stuart Board Index (2018); Ning Chiu, Board Composition at the S&P 500 Companies (Davis Polk & Wardwell LLP, December 2, 2016).

xv Jeff Green, Jordyn Holman, Janet Paskin, “America’s C-Suites Keep Getting Whiter (and More Male, Too)” (Bloomberg Businessweek, September 17, 2018).

xvi Alison Cook, Christy Glass, “Above The Glass Ceiling: When Are Women and Racial/Ethnic Minorities Promoted to CEO?” (Strategic Management Journal, June 10, 2013).

xviii William H. Frey, “The Millennial Generation: A Demographic Bridge to America’s Diverse Future” (The Brookings Institute, January, 2018).

xx Jonathan Vespa, David M. Armstrong, Lauren Medina, “Demographic Turning Points for the

United States: Population Projections for 2020 to 2060 Population Estimates and Projections” (U.S. Census, Current Population Reports, March 2018)

xxii Camille Patrick, Ella Washington, “3 Ways Millennials Can Advance Workplace Diversity and Inclusion” (Gallup Workplace, November 30, 2018).

xxiii Bureau of Labor Statistics, “Labor Force Projections to 2024: The Labor Force Is Growing, But Slowly” (Monthly Labor Review, December 2015).

xxiv Mitra Toossi, “A Look At The Future Of The U.S. Labor Force To 2060” (U.S. Bureau of Labor Statistics, September 2016).

Categories
Diversity Statistics Workplace Diversity

As we protest racism in the streets, we must also address it in the workplace

We cannot pretend that institutional racism doesn’t exist when we see repeated violence and hatred against Black Americans. And we cannot pretend that same racism doesn’t spill over into all American institutions, including the workplace.

Right now, Americans in all 50 states are protesting the long history of police brutality against Black men and women after the killing of George Floyd by a (now-former) Minneapolis police officer and the officers’ complicity around him.[1]  The productive outrage helps illuminate racial disparities and inequality that has been pervasive – but that many of us have chosen to ignore – in all American institutions.

In a recent interview, Bishop T.D. Jakes addressed the anger and frustration felt by the Black community:

“We want what you want. It’s not a mystery. We want to grow old. We want to live. We want a chance at opportunities. We want better education…We want that when a PPP [Payment Protection Program] comes through, and a CARES Act comes down, we want the bank to treat us like they treat you and to give equal access to opportunities…We are not asking not to be arrested. We are just asking not to be tried on the sidewalk. Just don’t arrest me, try me, convict me and kill me on the sidewalk…You can’t be that blind that you don’t see that.” [2]

The recent high-profile racial violence has played out against the backdrop of a lethal pandemic that has killed Black Americans at twice the rate of white Americans.[3] Public health experts have long known the factors that determine such health outcomes, which are the conditions in which people live, work, learn, and gather. [4] These factors are all tied to what people can afford. With historically large racial disparity in employment and earnings, and thus, access to healthcare, it’s no surprise that Black Americans have been the most harmed by Covid-19, and that public health officials are warning that racism is in fact an urgent public health threat.[5] Skyrocketing unemployment due to the pandemic has only exacerbated these issues.

Within this context, we need to understand that protestors are also fighting to end the racism that keeps so many Black Americans from building the same quality of life that the rest of us enjoy.

And we can’t be blind to how that is connected to racial inequality in the workplace. Here are some facts:

1. The unemployment rate has historically been twice as high for Black Americans as it is for white Americans, and the pandemic has only made the disparity worse.

This year, 41 million people in the U.S. have filed for unemployment, mainly due to the effects of the COVID-19 pandemic. Currently, the country’s current unemployment rate sits at roughly 16.3%. [6] Our most recent data shows that 16.8% of Black Americans are out of work. Latinx workers had the highest unemployment rate in May – 17.6%.[7] Many people cheered this week when it was announced the overall unemployment rate surprisingly dropped in May when it was widely expected to increase.

But unemployment rates for Black Americans and Latinx workers did increase, while white unemployment dropped to 12.4% from 14.2%.[8]  Even more frustrating is that in August of 2019, Black workers in the U.S. had a record low unemployment rate of 5.4%.[9] That has now been erased.

2. Employees of color are much less likely to be given opportunities to climb the corporate ladder.

We know that this phenomenon cannot be explained by the fact that white men and women are more educated than their counterparts because that simply isn’t true. We’ve long known that deep-seated racism has kept people of color with the same qualifications out of jobs as well as prevented them from rising through the ranks at the same rate as white workers. Gender bias makes this even more difficult for women of color.

3. Black and Hispanic men and women are paid less to do the exact same jobs as their white counterparts.  

Even when controlling for education, Black and Hispanic men earn roughly 80% of white men’s hourly earnings in recent years, and Black and Hispanic women earn just 70% of similarly educated white men.  Research also shows that these people of color have made almost no progress in narrowing the wage gap since 1980.[10]

4. People of color are less likely to be elected to public office where they would be in positions of influence to create and promote policies for change.

Equal representation is one of the founding guidelines of American democracy, and it increases federal agencies’ ability to serve and protect people who come from different backgrounds. We know from experience that we cannot create effective public policy if policymakers don’t understand the issues and concerns of the citizens they serve. [11]

Racism is clearly systemic. It’s widespread. It’s embedded in the norms of our society and all of our institutions. And we need to acknowledge this before systems of oppression can be eliminated.

In a video this weekend, longtime San Antonio Spurs head coach Gregg Popovich addressed the critical role white Americans play in standing against racial inequality in the wake of the George Floyd killing. He stated:

“We [white people] have to do it. Black people have been shouldering this burden for 400 years…The only reason this nation has made the progress it has is because of the persistence, patience and effort of Black  people…it’s got to be us, in my opinion, that speak truth to power and call it out, no matter what the consequences. We have to speak.” [12]

The unwillingness of white people in positions of power – who make up the vast majority of corporate and government leadership – to stand against racism means these inequalities will continue to thrive in our streets and in our workplaces. And the protests must continue to be a catalyst for change. We must be open to listening to those who have been harmed by our current systems. And we cannot fear equality or assume that we will lose something by lifting others and supporting their cause.

Just as we’re protesting racial violence, we need to address the racial inequality we see in our workplaces that keeps Black Americans and all people of color from accessing opportunities to create better lives. Employment equality is a human right that belongs to all of us.

Visit our workplace diversity hub for further reading relating to current challenges faced by women and people of color, wage gaps, successful inclusion strategies, diversity in corporate and government leadership, effective talent acquisition and diversity programs, and how artificial intelligence affects diversity outcomes.

Related articles on Diversity Jobs:

We Know Diversity is Good for Business, So Why Do Corporate Leaders Remain Predominantly White and Male?” (2019)

“Can AI Help Us Create a More Diverse Workforce Or Will It Reinforce the Status Quo?” (2019)

“Race, Gender, and LGBTQ+ wage gaps are real – and they end up costing us all” (2020)

“Congressional Diversity Grade Leaps From an ‘F’ to … well, it’s still an ‘F’” (2019)

“Traditional Diversity Training Doesn’t Work. Why Not? And What Does?” (2019)

Sources cited:

[1] https://www.nbcnews.com/news/us-news/map-protests-rallies-george-floyd-spread-across-country-n1220976

[2] https://twitter.com/hillsongworship/status/1268040069627011073?s=20

[3] https://covidtracking.com/race

[4] https://www.cdc.gov/socialdeterminants/index.htm

[5] https://www.npr.org/sections/coronavirus-live-updates/2020/06/01/867200259/protests-over-racism-versus-risk-of-covid-i-wouldn-t-weigh-these-crises-separate

[6] https://www.washingtonpost.com/business/2020/06/05/may-2020-jobs-report-misclassification-error/

[7] https://www.urban.org/urban-wire/latinx-unemployment-highest-all-racial-and-ethnic-groups-first-time-record

[8] https://www.bls.gov/news.release/empsit.nr0.htm

[9] https://www.cnbc.com/2020/06/05/coronavirus-recovery-black-workers-are-being-left-out-data-shows.html

[10] https://www.pewresearch.org/fact-tank/2016/07/01/racial-gender-wage-gaps-persist-in-u-s-despite-some-progress/

[11] https://www.opm.gov/faqs/QA.aspx?fid=72bcd219-0b9f-4de8-b366-4817028fbc6e&pid=f2ef3151-b4f2-4f47-a319-acad8175b0b7

[12] https://twitter.com/i/status/1269282905861378049


Brad Boggs

Brad is the President of DiversityJobs.com & LatPro, Inc.

Categories
Cartoons Diversity Statistics Workplace Diversity

What millions of Google searches for ‘jobs’​ indicate about diversity

Did you know there are millions of searches every month for ‘jobs’ on Google?

Naturally, people use search terms that match their interests and experience, with phrases like ‘engineering jobs’ or ‘jobs in finance.’ And it’s no surprise that people often add geographical factors to narrow the results, such as ‘in Dallas,’ ‘near me,’ or ‘remote.’

What’s intriguing is that job seekers also use terms that identify their backgrounds and that reveal truths about themselves. We know this because web analytics allow us to see how many people are using phrases like ‘diversity jobs,’ ‘jobs for Hispanics,’ ‘African American jobs,’ ‘jobs for Asians,’ ‘bilingual jobs,’ ‘multicultural jobs,’ ‘jobs for women,’ ‘LGBT jobs,’ ‘disability jobs,’ etc.

These millions of searches reveal three critical components of job search:

These searches are being conducted on Google – not on the big, Name-Brand job search sites. Maybe it’s just convenient to Google-search. Or perhaps job seekers are looking for alternatives to general job sites with millions of other candidates, and they want to stand out from the crowd.
Job seekers are searching for more meaningful careers that match who they are as unique individuals. People don’t run searches for ‘jobs’ along with diverse terms – ‘veteran,’ ‘women,’ ‘LGBT,’ or ‘people of color’ – unless that is who they are and what they care about projecting.
These searches make it clear that job seekers are hoping to land that next opportunity with a diversity-friendly employer in an inclusive environment.

That’s the reason for DiversityJobs.com

Our mission is to promote diversity and inclusion in the workplace by creating a space where job seekers can start meaningful careers with employers who value diversity.

If you are a job seeker, search for jobs from top employers, and upload your resume.

If you are an employer looking to engage diverse candidates, learn about how our job scraping services can boost your diversity recruiting efforts, and read about supported Applicant Tracking SystemsContact Us to discuss your needs and to schedule a demo.

Categories
Diversity Statistics Government Workplace Diversity

Congressional Diversity Grade Leaps From an ‘F’ to … well, it’s still an ‘F’

Even with record turnout from an increasingly diverse population, a record number of women and people of color being elected, and many notable firsts that are changing the face of our leadership, our 116th Congress will remain overwhelmingly white – and male – compared to the overall population.

And because Congress is under no obligation to report on the gender or ethnic diversity of its members, DiversityJobs.com has done the work to show you.

With our own unique analysis of diversity below, we’ve illustrated how far we’ve come – and just how far we have to go – when it comes to the equal representation in Washington.

Congressional Diversity Index

The following chart shows our Congressional Diversity Index, which illustrates overall diversity in Congress over time.  To arrive at the score, we used the mean between the gender and ethnic diversity scores we’ll discuss below (which helps avoid double-counting women of color, for example, who fit into both categories).

As you can see, by 2018, Americans had elected women and people of color as representatives to both the House and Senate at three times the rate they did in 1980. But since we determine our score by calculating the percent of women and people of color in Congress in proportion to their makeup of the U.S. population, simply put, a diversity score of 50.3% means that we barely see diversity in Congress at half the rate seen in our population.  And this is our most diverse Congress ever!

The next graph dives deeper with an analysis of two groups – women (of all ethnic backgrounds) and (all) people of color. Here, we have provided a score for six Congressional classes since 1980 based on gender and ethnic diversity in relation to the U.S. population that particular year. In a Congress perfectly representative of its constituents, each group would reach the 100% line, resulting in a combined index score (above) of 100%.  This is a powerful way of visualizing how far away we remain from equal representation amongst our federal lawmakers.


Currently, people of color make up about 38% of the U.S. population, so a perfect score would mean they also make up 38% of Congress.  Instead, non-white lawmakers represent a little more than half of what they should in relation to the population this year, earning our newly elected Congress a diversity score of 54.2% – or in grade terms, an ‘F’.  Ethnic diversity for men and women in Congress increased by roughly 30% since 1980, a mighty feat indeed, but the gap between ‘equal’ and ‘current’ representation is still glaring.

[mks_pullquote align=”right” width=”450″ size=”24″ bg_color=”#ffffff” txt_color=”#d51a1a”]…a diversity score of 50.3% means that we barely see diversity in Congress at half the rate seen in our population. And this is our most diverse Congress ever!”[/mks_pullquote]While the number of women in Congress shows steady growth since 1980, our current gender diversity score for Congress is a measly 46.4% – a failing grade by any standard. People of color are doing better, but women of all ethnicities have made the least headway. Even as the most recent votes are tallied and we can celebrate the victories of our first two Muslim women, first two Native American women, first female senator from Tennessee and first two Latina representatives from Texas, white men still make up the vast majority of Congress.

Even more striking is that the U.S. lags behind 102 other countries in gender diversity in politics (Rwanda, Cuba, Bolivia, Mexico, and Granada lead the world and countries from Sweden to Afghanistan are far ahead of us). American women have had the right to vote nationally for almost 100 years, but at this rate, it could take another hundred to reach full legislative parity.

Of course, you might look at the graph and find it staggeringly progressive – there has been over a 500% increase in females elected to Congress since 1980!  Hooray!  You might be less impressed when you consider this is an increase from almost no gender diversity in 1980.  And the number of female representatives has only increased from 18 to 126 (currently projected for the 116th Congress) over the last 38 years. Compare this to the 428 men in the current Congress and you’ll see we’re a long way from equality since women make up 50-51% of the U.S. population.

On a related side-note, it should be pointed out that the underrepresentation of women and people of color shown in these charts is eerily similar to what we see in America’s top companies, where leadership remains predominantly white and male.

It’s expensive to run for Congress and candidates need education and experience to get their names on the ballot. This serves as a barrier to anyone who doesn’t come from money or power. And yet, the biggest barrier still seems to be gender.

Is this phenomenon simply explained by the low number of women who run for Congress versus men? After all, a record number of women (309) were running this year, which was a 90% increase over 2016, and is still a fraction of the 1,103 men who ran.  Is this a byproduct of our democratic system which forces women to contend with sexism and stereotypes in the general public to win the vote, as opposed to countries with a parliamentary system where women are chosen by the party?

It’s all very controversial and deserves deeper investigation.  But no matter the reasons for this disparity, women are often the writers and advocates of bills on gender equality, reproductive health, and issues affecting families and children, so this could have much larger implications for us and our nation’s children.

Making progress, slowly

While the 115th and 116th Congresses are the most diverse in history, with record numbers of Hispanics, African-Americans, Asian-Americans, and women of color joining the ranks – particularly among Democrats – we get a different perspective when we break down these stats in relation to the demographics of our population over time.

Since 1980, the largest gains in terms of equal representation have been seen among black/African-Americans and American Indians/Alaska Natives (for which the 116th Congress earns a solid grade of 73.9% and 73.8%, respectively).  The meteoric rise of American Indians/Alaska Natives looks particularly impressive on the graph, but until this week, that only accounted for two representatives in all of Congress.

Hispanic/Latinx people are particularly underrepresented in Congress relative to their presence in the population, and there is less Hispanic representation in our new Congress than there was in our last.  Still, the number of Latinx representatives has doubled since 2001. Their increasing population, advocacy, and engagement efforts, as well as their increasing incomes, mean we might start to see this group get closer to full representation in Congress faster than any other.

America’s fastest-growing population are Asian/Pacific Islanders, who had the best relative diversity score back in 1980 – at 73.3% you might even convince a nice teacher to call that a ‘C’ instead of a ‘C-‘. But that population was also the only one to experience a decrease in diversity in the period we examined – their scores went down for three straight decades between 1980 and 2010.

A new look at diversity in our 116th Congress

When we break down each ethnic group by gender in our 116th Congress, white males (representing 64.2% of Congress while making up roughly 30.3% of the population) still dwarf the number of representatives of every other group.  Their proportional representation of over 211% is nearly three times that of African-American males (79.1%), four times that of Hispanic males (54.1%), and over seven times that of Asian males (30%).

The privilege in play here, while certainly white, does not extend to white women – they have less than a quarter of the equal representation of their male counterparts.  In fact, white women rank lower than men in every ethnic category (except Asians) and rank eighth out of the ten groups.

The lowest proportional representation for any group is Hispanic females, who make up the second-highest percentage of the general population.

Why do we need a diverse Congress?

Diversity isn’t just some politically correct buzzword.  It’s an important factor in how well our country operates.

[mks_pullquote align=”left” width=”450″ size=”24″ bg_color=”#ffffff” txt_color=”#d51a1a”]…in our 116th Congress, white males…still dwarf the number of representatives of every other group. Their proportional representation is nearly three times that of African-American males, four times that of Hispanic males, and over seven times that of Asian males.”[/mks_pullquote]Seeing people who look like you in positions of power makes you feel empowered, and makes you feel like your voice and concerns are capable of being heard. Encouraging the growing number of Hispanic, Asian, black, and multiracial Americans in our population to recognize that a political career is within reach enriches their participation in neighborhoods, cities, and organizations, and expands their career goals.

This “seeing is believing” phenomenon actually works on all of us – women are empowered by seeing female role models, and working-class white men have been beneficiaries of seeing men of diverse socio-economic status rise in the ranks in politics and business as well.

Equal representation is one of the founding guidelines of American democracy, but it also saves us time and money. Diversity in Washington increases federal agencies’ ability to successfully serve and protect people who come from different backgrounds. We know from experience that we cannot create effective public policy if policymakers don’t understand the issues and concerns of the citizens they serve.

Plenty of science provides evidence that diversity is good. Being around people different from ourselves makes us smarter by allowing us to see other perspectives, anticipate problems, and incorporate alternate viewpoints into policies that will do the most good for the largest number of people.

How has progress been made?

Diversity doesn’t just happen in places of power without the hard work and advocacy of both the underrepresented and their allies. In the 38 years covered by our graphs above, various historical events led to the acceptance of women and people of color as lawmakers.

African-Americans, in particular, found much success in local elections prior to the 1980s. When a large number of seats opened up in the 1990s following retirements and scandals, a large group of diverse candidates with legislative experience who were both qualified and visible were ready to run for office. As a bonus, they were Washington outsiders, untainted by things like the House banking scandal in 1991.

[mks_pullquote align=”right” width=”450″ size=”24″ bg_color=”#ffffff” txt_color=”#d51a1a”]The privilege in play here, while certainly white, does not extend to white women – they have less than a quarter of the equal representation of their male counterparts. In fact, white women rank lower than men in every ethnic category (except Asians) and rank eighth out of the ten groups.”[/mks_pullquote]In 1992, the so-called “Year of the Woman,” a large voting block of women materialized and elected more women to Congress (specifically the Senate) than ever before, which is why we see the largest percentage increase in female lawmakers between 1990 and 2000.

The mid-to-late 1990s saw a shift in national funding priorities away from national security to areas such as education, health care, welfare reform, and the economy – areas where women were a significant part of the workforce and advocacy movements.

Moving forward, we can undoubtedly count on recent events like the Women’s March, the visibility of the #MeToo movement, and the increasing number of women serving in the military to have an impact on the number of female lawmakers in office.

Celebrate, with perspective

This week’s election provided some hopeful moments for the future of Congress. Rashida Tlaib (D – Michigan) and Ilhan Omar (D – Minnesota) became the first Muslim women elected to Congress; Sharice Davids (D-Kansas) and Deb Haaland (D – New Mexico) will join them as the first two Native American women; we elected our youngest congresswomen ever with Alexandria Ocasio-Cortez (D – New York) and Abby Finkenauer (D – Iowa), both 29; Finkenauer joins Cindy Axne (D) as the first women from Iowa to serve in the House; Ayanna Pressley (D) was elected Massachusetts’ first black Congresswoman; Lauren Underwood (D) became the first black woman to ever win Illinois’ 14th District; and Kansas elected its first LGBTQIA+ representative.

While it’s important to celebrate these victories and applaud the great strides we’ve made as a country, it’s also imperative that we keep these in perspective and recognize the amount of work that still needs to be done to achieve a Congress as diverse as our population.

___

Visit our workplace diversity hub for further reading relating to current challenges faced by women and people of color, wage gaps, successful inclusion strategies, diversity in corporate and government leadership, effective talent acquisition and diversity programs, and how artificial intelligence affects diversity outcomes.

Special thanks to Dr. Jessica Baron (@baronatrix) and Norika Francis-Mezger for your contributions.